Map Gallery
-
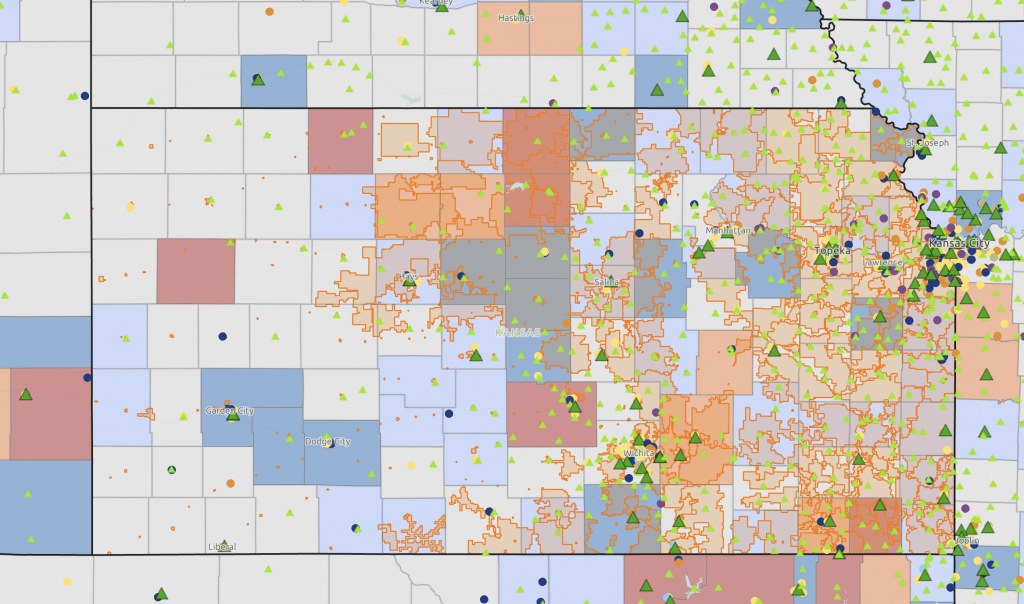
Explore data related to drinking water quality, public supply, and bottling. Data for this map comes from USGS, the Kansas Water Office, and the EPA.
-
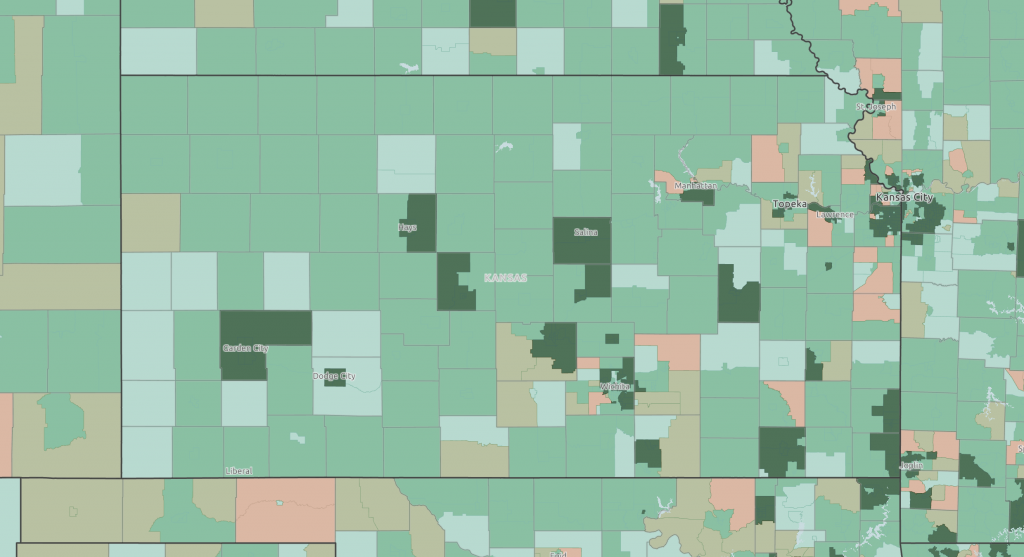
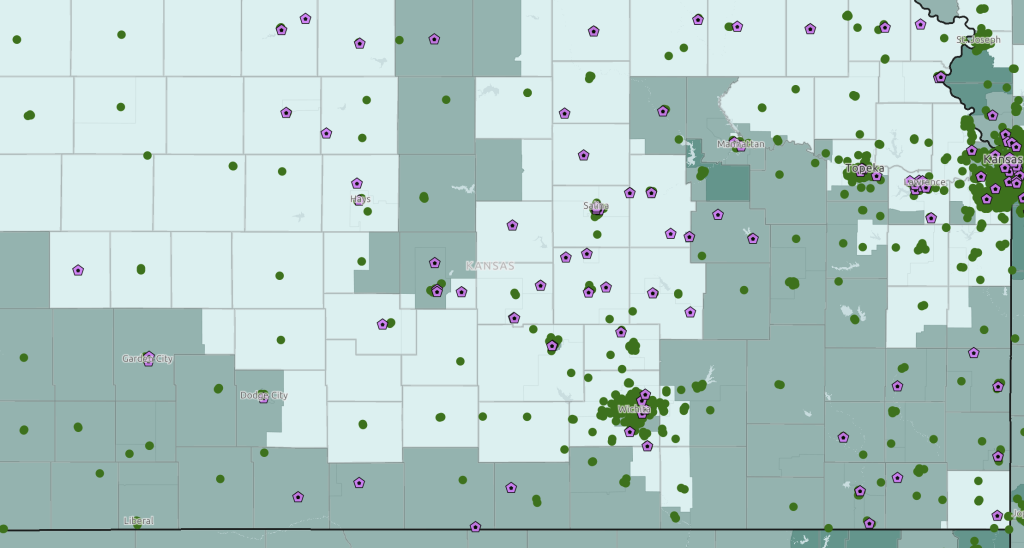
What does banking access look like in your community? Use this map to view banking deserts, bank proximity, and predatory lenders.
-
Explore data related to school enrollment, youth employment, and student homelessness.
-
Explore the highest pay job sectors by ownership type (private, local, state, or federal government). These data are available by state and county.
-
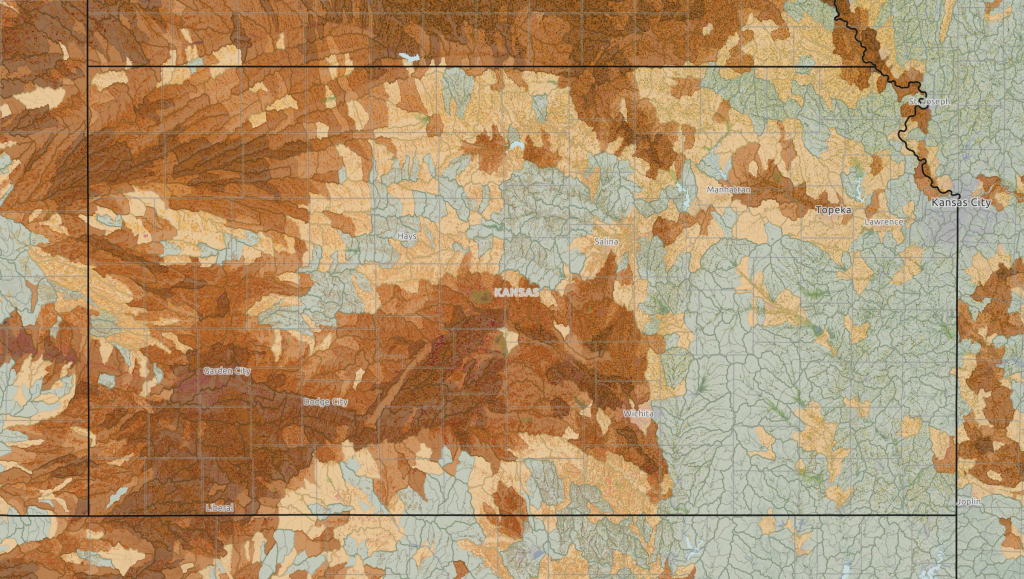
Where does our water go? Learn more about irrigation usage, surface water, and cropland across Kansas.
-
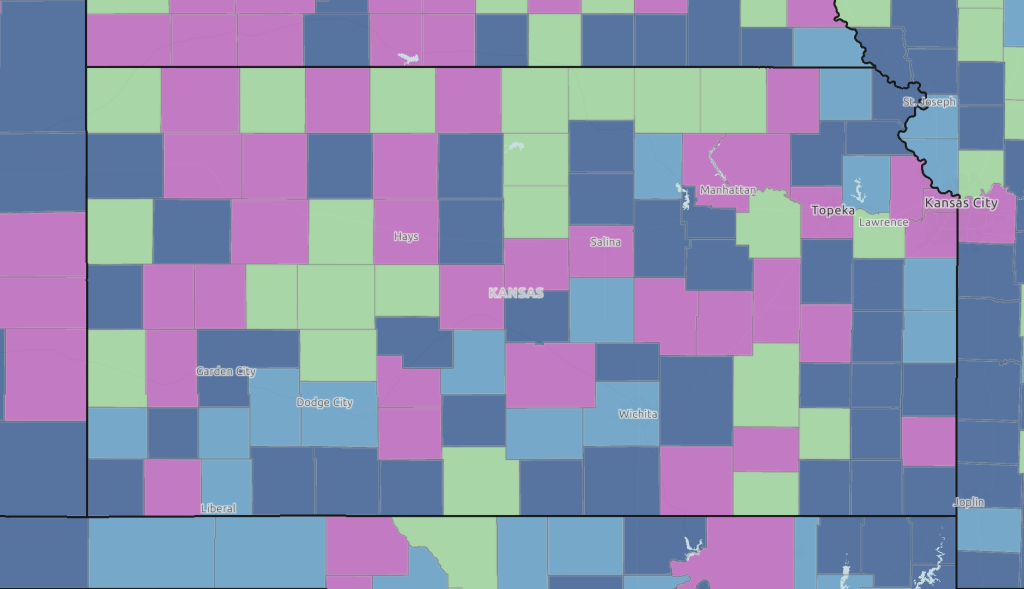
View rates of children in poverty (age 0-4) and childcare facilities across state House districts.
-
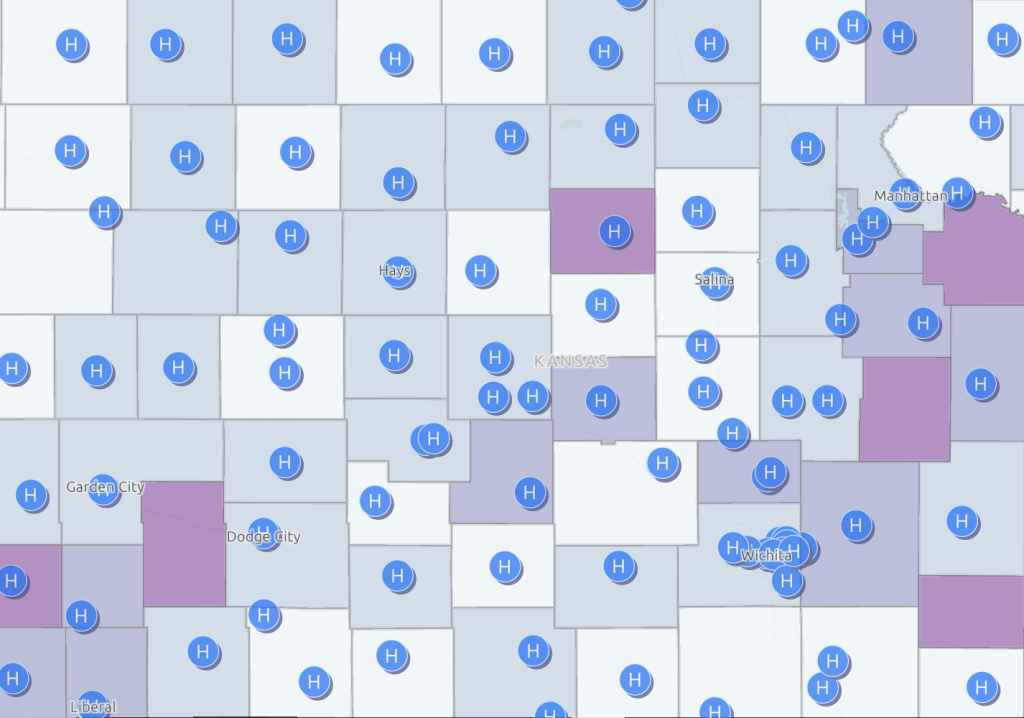
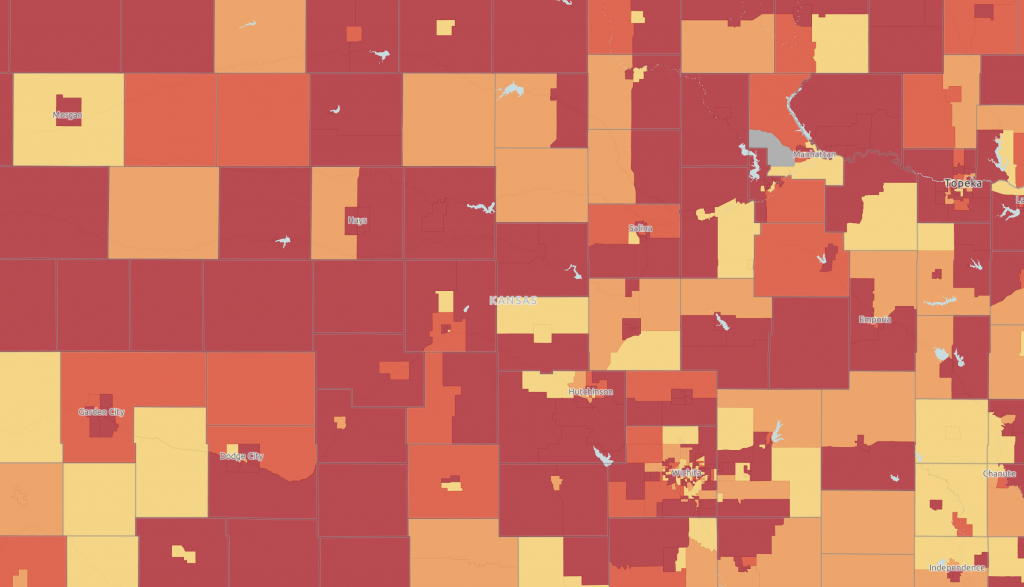
View the healthcare infrastructure vulnerability index and hospital locations across Kansas.
-
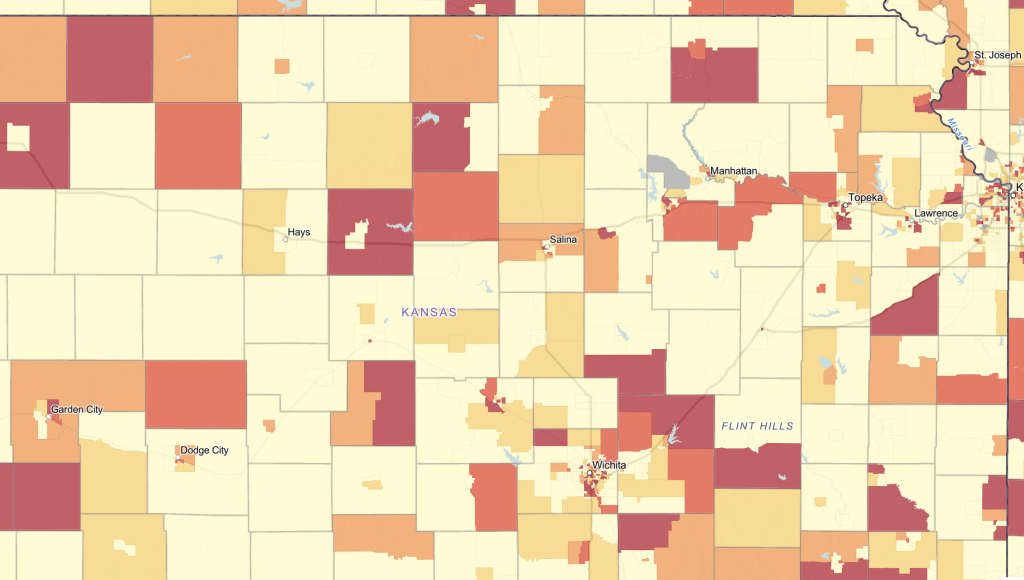
View the prevalence of youth who are not working and not in school by census tract.