Skip to Main Content
Powercat chevron double-chevron chat-purple news-purple briefcase-purple chart-purple home medal-purple computer window with a question mark close facebook linkedin menu search twitter youtube play apply-purple apply-white chat-white request-purple request-white
Kansas State University
Sign in
Kansas State University
All Things Kansas
  • Maps
    • Map Room
    • Map Gallery
    • Map Data List
  • Reports
    • Report Gallery
    • All Things Kansas Report
    • Kansas County Health Rankings Report
    • Kansas Economic Development Report
    • Kansas Housing Report
  • Build Your Business
    • Build Your Business in Kansas
    • Build Your Food Business in Kansas
  • Support
    • FAQ
    • What’s New?
    • Map Room Support
    • Report Support
  • K-State home
  • All Things Kansas
  • Map Gallery

Map Gallery

  • The search data window in the All Things Kansas Map Room
    Kansas Map Room

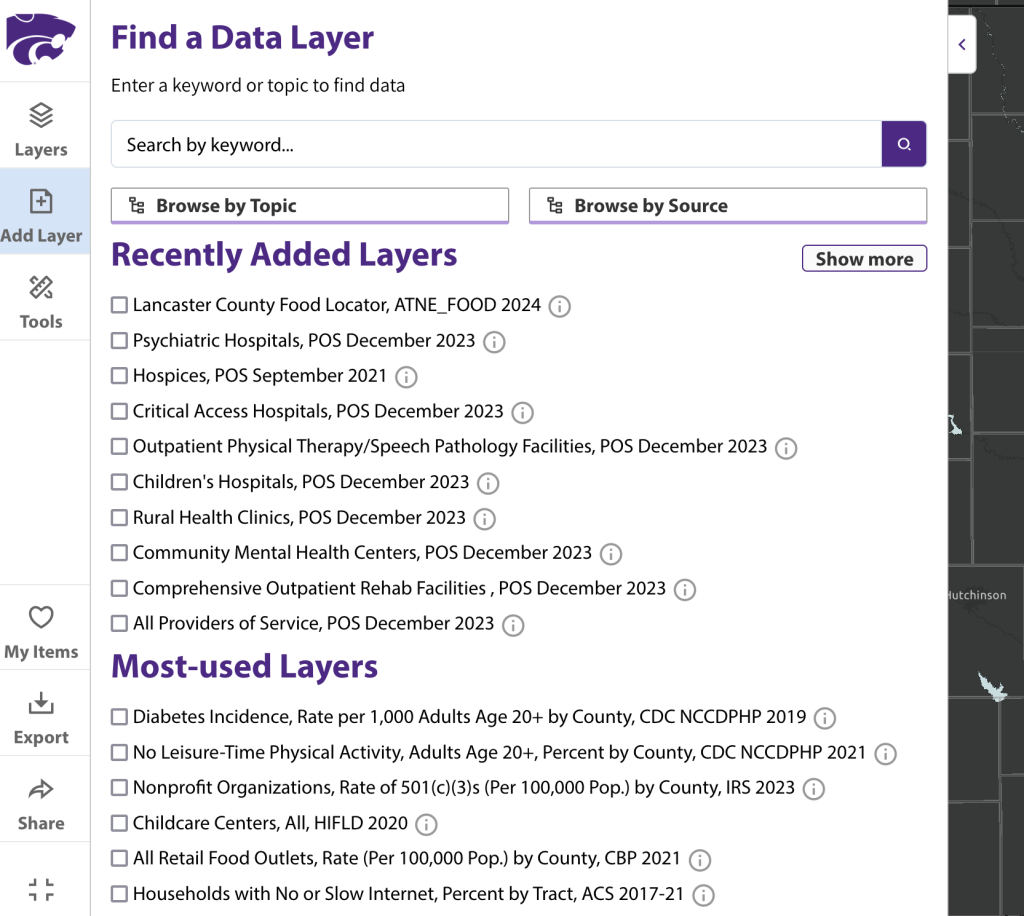
    Access more than 30,000 data layers from 120+ state and national sources in the Kansas Map Room.

    View map
  • A map of Kansas showing areas funded for broadband expansion and access.
    Broadband Access and Funding for Expansion

    View areas across Kansas funded for broadband expansion alongside access data.

    View map
  • A map of Wichita showing rates of housing cost-burden.
    Housing Costs

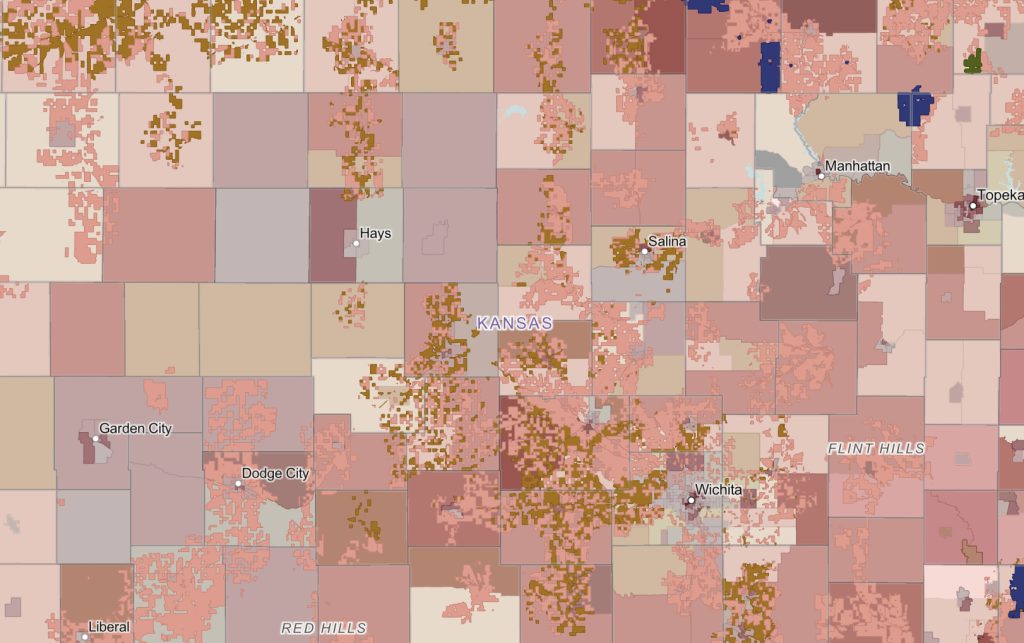
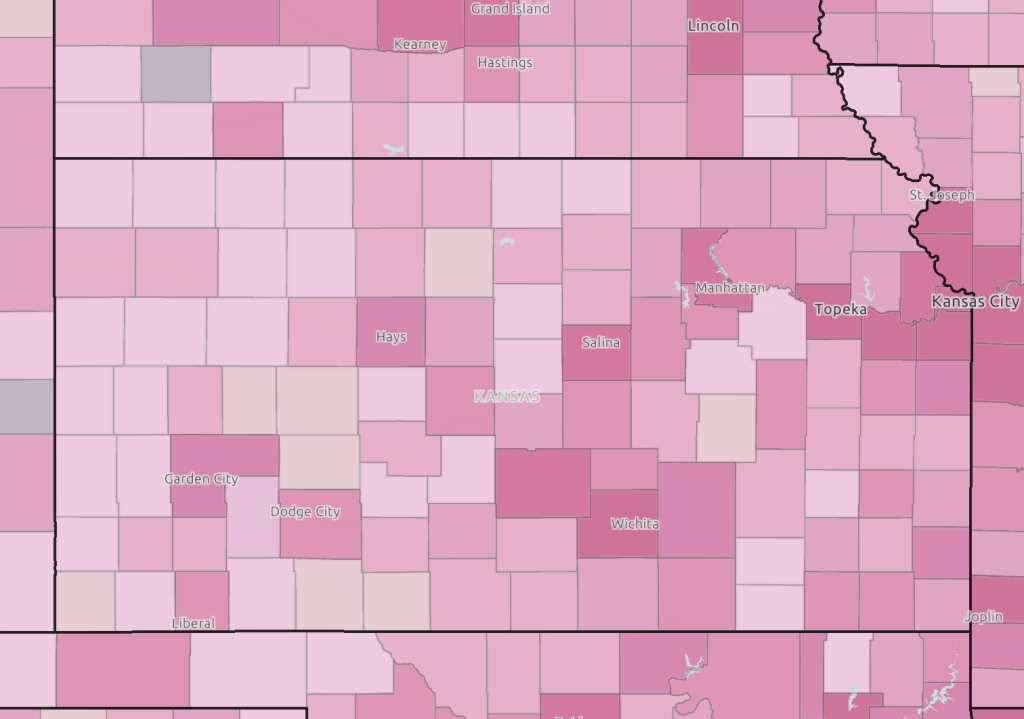
    View rates of households considered to be housing cost-burdened with average rent costs and poverty.

    View map
  • A purple map of cancer prevalence by county and food access.
    Cancer Prevalence and Food Access

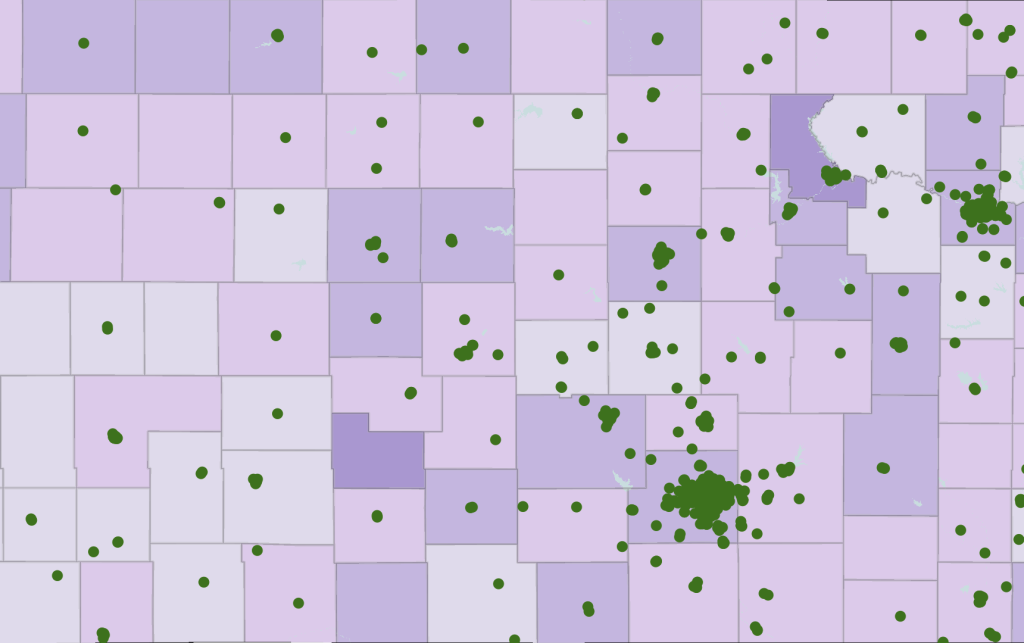
    Does food access impact cancer prevalence and mortality? Explore the map to learn more about food access and cancer across Kansas.

    View map
  • A colorful map of Kansas showing dominant employment industry by county.
    Drivers of Economic Change

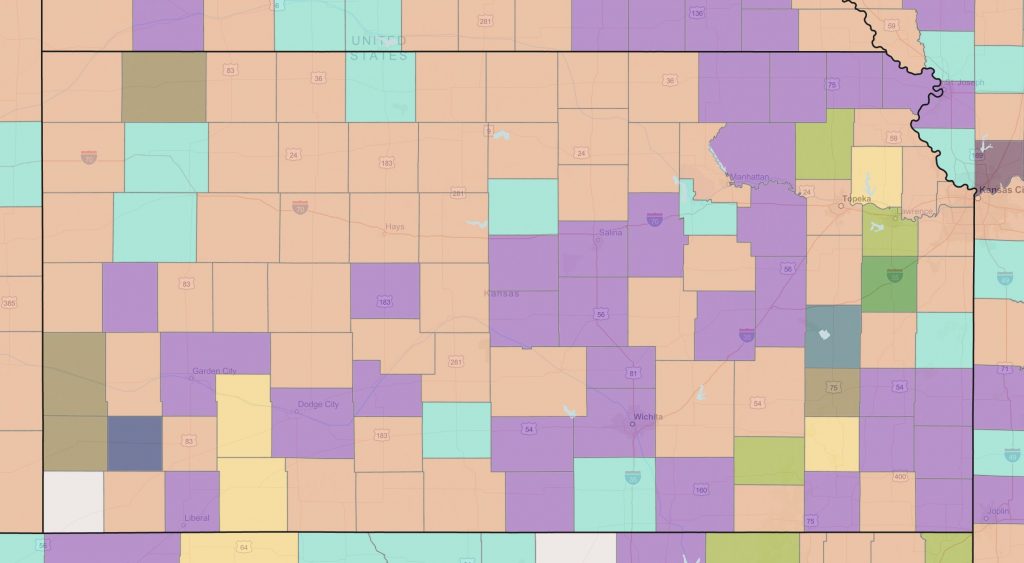
    Explore major drivers of economic change using the layers in this map. Dive into gross domestic product, business vacancies, dominant industries, and more.

    View map
  • A map of Kansas showing childcare costs and locations.
    Childcare Access and Affordability

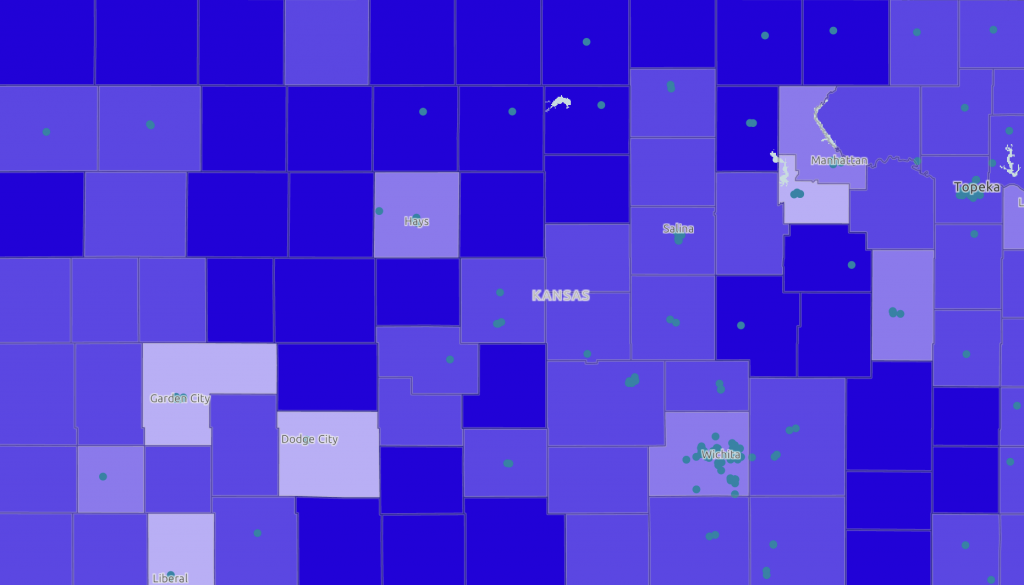
    View areas considered cost burdened and locations of childcare centers.

    View map
  • Map of Kansas showing business births and deaths alongside churn rates by county.
    Business Churn, Births, and Deaths

    View business “churn” by county. Explore business births and deaths alongside churn rates by county.

    View map
  • A map of Wichita showing census tracts highlighted in orange, purple, and red.
    Vulnerable Populations Footprint

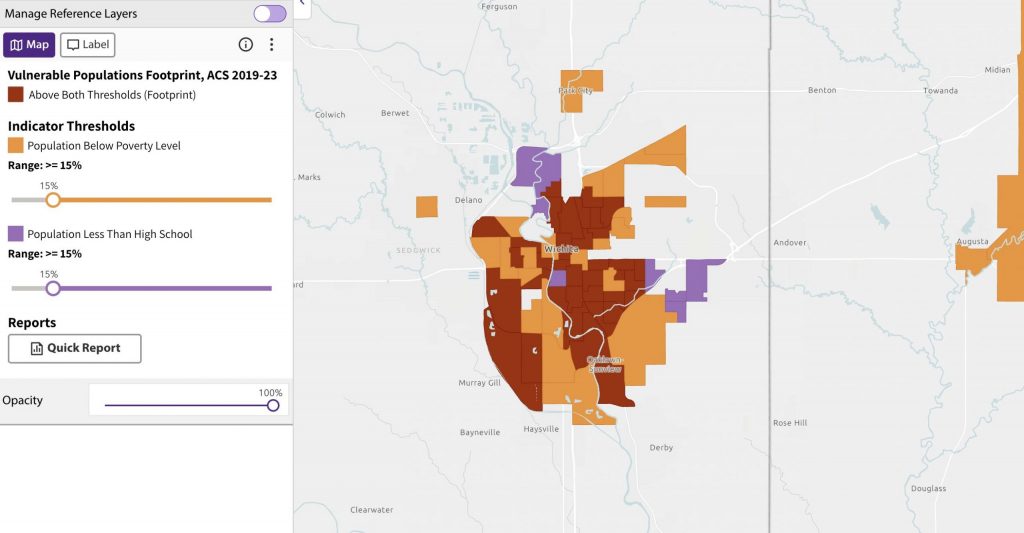
    The Vulnerable Populations Footprint examines the intersection of poverty and educational attainment and helps to identify areas of greatest need by census tract.

    View map

Posts navigation

12…7Next
apply-white chat-white request-white

Office of External Engagement — Economic Development

110 Anderson Hall

919 Mid-Campus Drive North, Manhattan, KS 66506

785-532-6221 | ecodevo@k-state.edu

Kansas State University
  • Contact Us
  • Emergency
  • Statements and Disclosures
  • Accessibility
  • Kansas Degree Statistics
  • KBOR Free Expression Statement
  • © Kansas State University