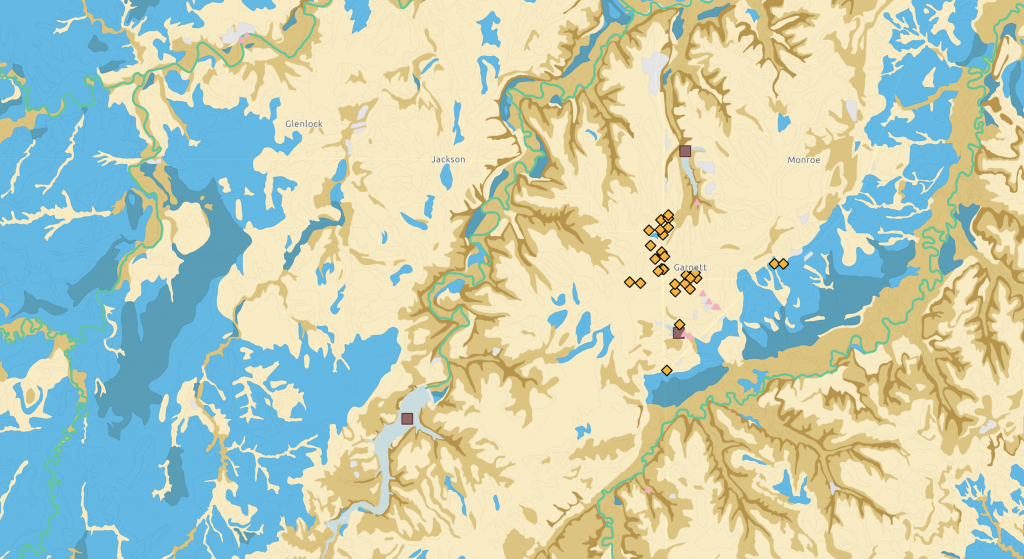
Skip to Main Content
Powercat chevron double-chevron chat-purple news-purple briefcase-purple chart-purple home medal-purple computer window with a question mark close facebook linkedin menu search twitter youtube play apply-purple apply-white chat-white request-purple request-white
Kansas State University
Sign in
Kansas State University
All Things Kansas
  • Maps
    • Map Room
    • Map Gallery
    • Map Data List
  • Reports
    • Report Gallery
    • All Things Kansas Report
    • Kansas County Health Rankings Report
    • Kansas Economic Development Report
    • Kansas Housing Report
  • Build Your Business
    • Build Your Business in Kansas
    • Build Your Food Business in Kansas
  • Support
    • FAQ
    • What’s New?
    • Map Room Support
    • Report Support
  • K-State home
  • All Things Kansas
  • Map Gallery
  • Page 5

Map Gallery

  • Map of Kansas showing drought risk and annual precipitation.

    Drought Risk and Annual Precipitation

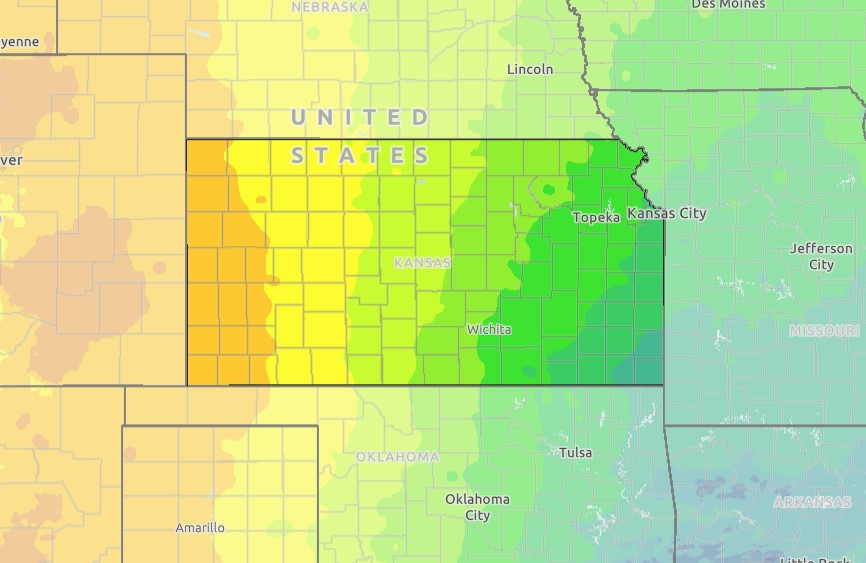
    View drought risk rating by county, as well as 30-year average annual precipitation across Kansas.
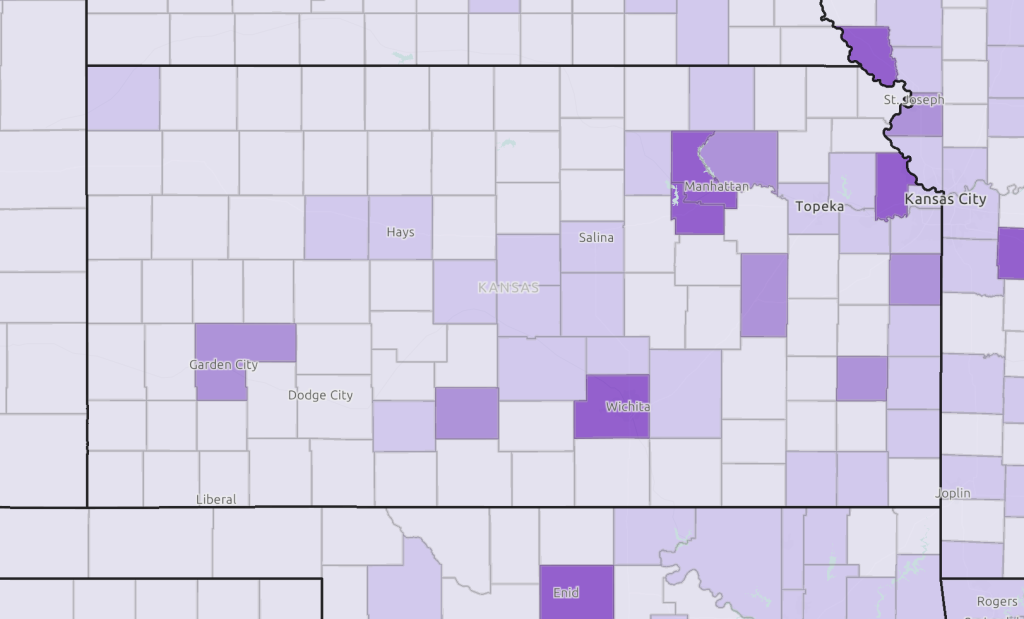
    View map
  • A map of Kansas showing population change.

    Population Change 2010-2020

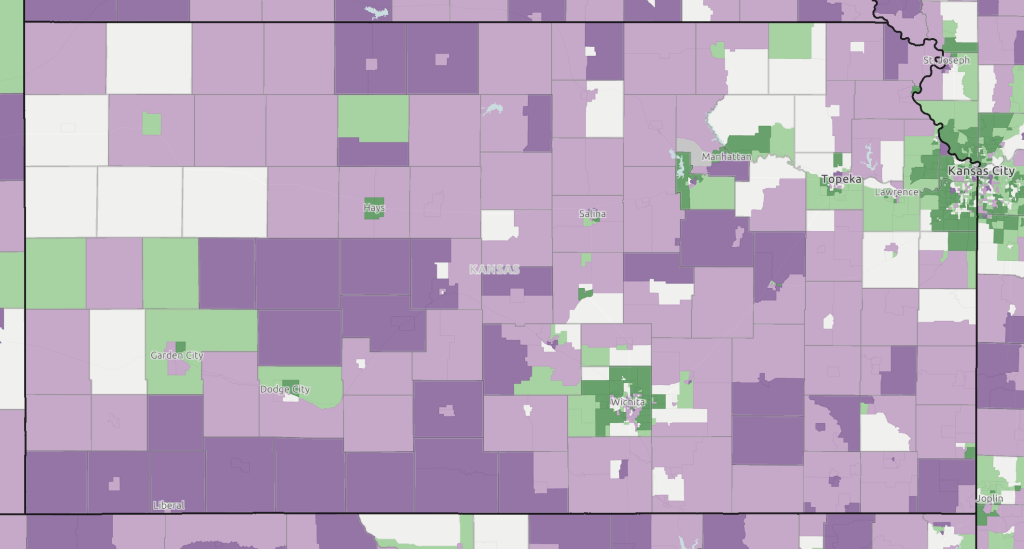
    View population change between 2010 and 2020. Toggle layers such as population change due to migration, births, and deaths to dive deeper.

    View map
  • A map of Kansas showing employment and lack of health insurance.

    Employment and Health Insurance

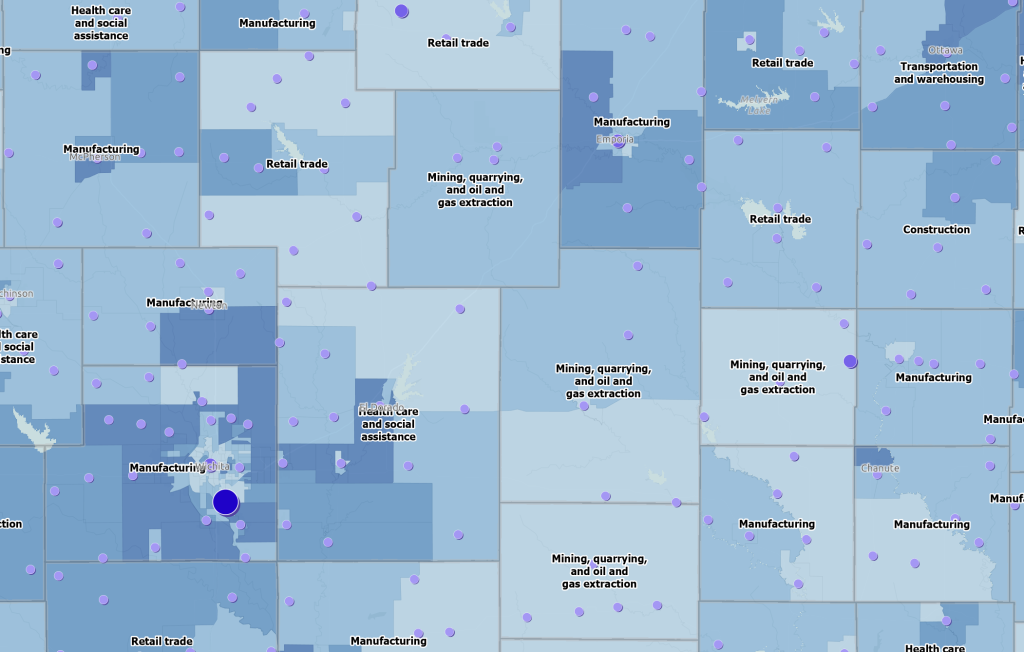
    What impact does industry have on health insurance? Use this map to learn more about dominant employers and health coverage across Kansas.

    View map
  • A zoomed in view of a map showing water drainage, impaired streams, and possible contaminants.

    Drainage, Discharge, and Impaired Waterways

    Learn more about waterways in your area. Use this map to view impaired streams, drainage, and possible contaminants.

    View map
  • A map of Kansas showing net migration by county

    Population, Migration, and Income

    View migration and income data to learn more about population change and economic impacts.

    View map
  • A map of food market assets across Kansas. Layers include locations of farmers markets, food hubs, on-farm markets, supermarkets, and SNAP retailer access.

    Food Market Asset Map

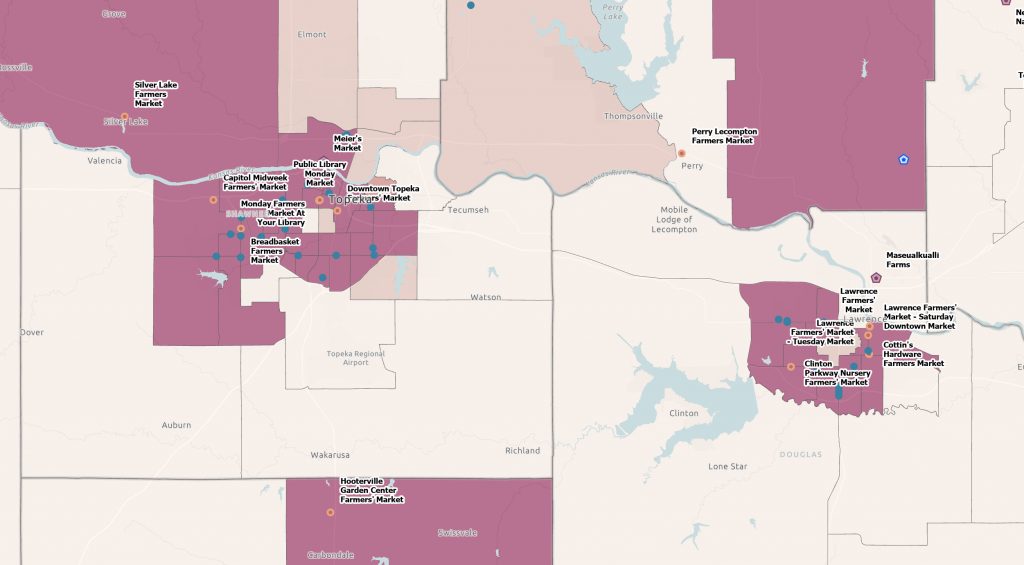
    Explore food market assets across Kansas. Layers include locations of farmers markets, food hubs, on-farm markets, supermarkets, and SNAP retailer access.

    View map
  • A blue map of Kansas showing the types of food businesses across the state.

    Food Business Landscape

    Explore food business prevalence by type. See how many fast food restaurants, convenience stores, supermarkets, and food specialty stores exist in your county or ZIP code.

    View map
  • A green map of Kansas showing locations of SNAP authorized retailers.

    SNAP-Authorized Retailers

    View SNAP-authorized retailers, farmers markets accepting SNAP benefits, and households receiving SNAP benefits to identify areas of need.

    View map

Posts navigation

Previous1…4567Next
apply-white chat-white request-white

Office of External Engagement — Economic Development

110 Anderson Hall

919 Mid-Campus Drive North, Manhattan, KS 66506

785-532-6221 | ecodevo@k-state.edu

Kansas State University
  • Contact Us
  • Emergency
  • Statements and Disclosures
  • Accessibility
  • Kansas Degree Statistics
  • KBOR Free Expression Statement
  • © Kansas State University