Map Gallery
-
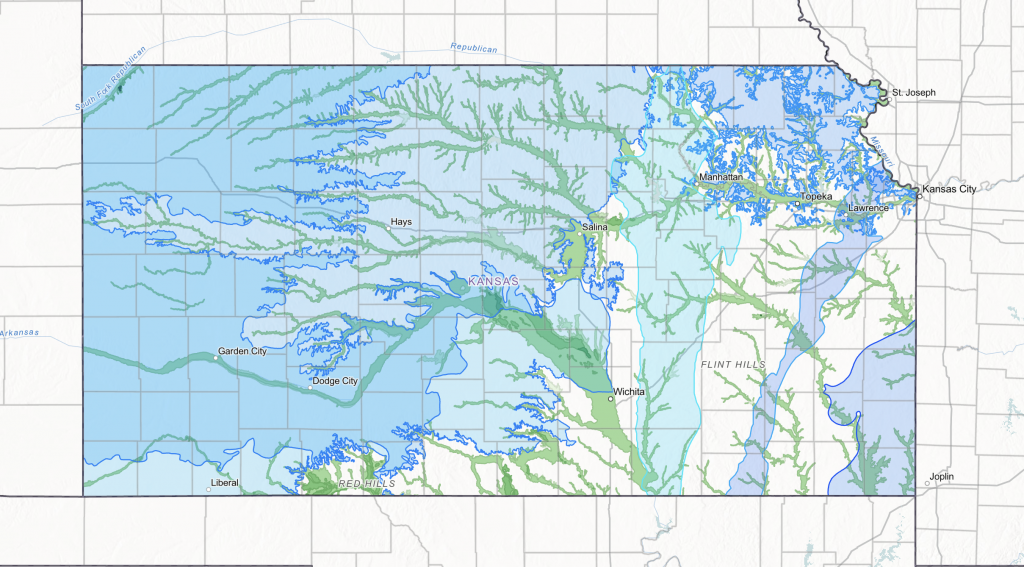
View aquifers across Kansas. Add your own layers to explore aquifers alongside agricultural, environmental, and usage data.
-
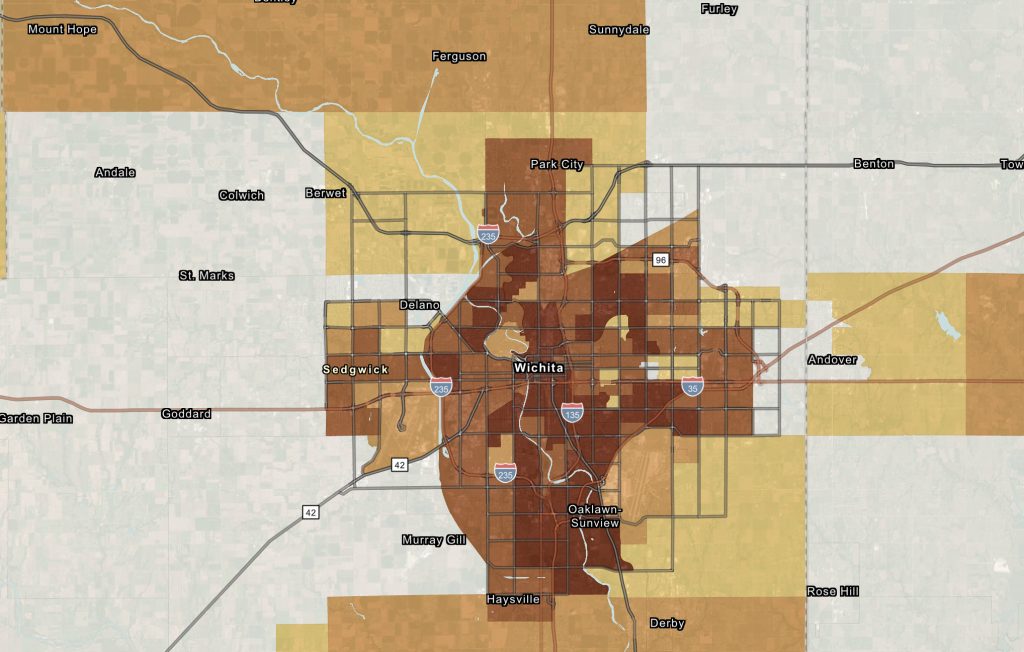
Explore areas where business vacancies are increasing and decreasing. Use the time period drop down to see change over time.
-
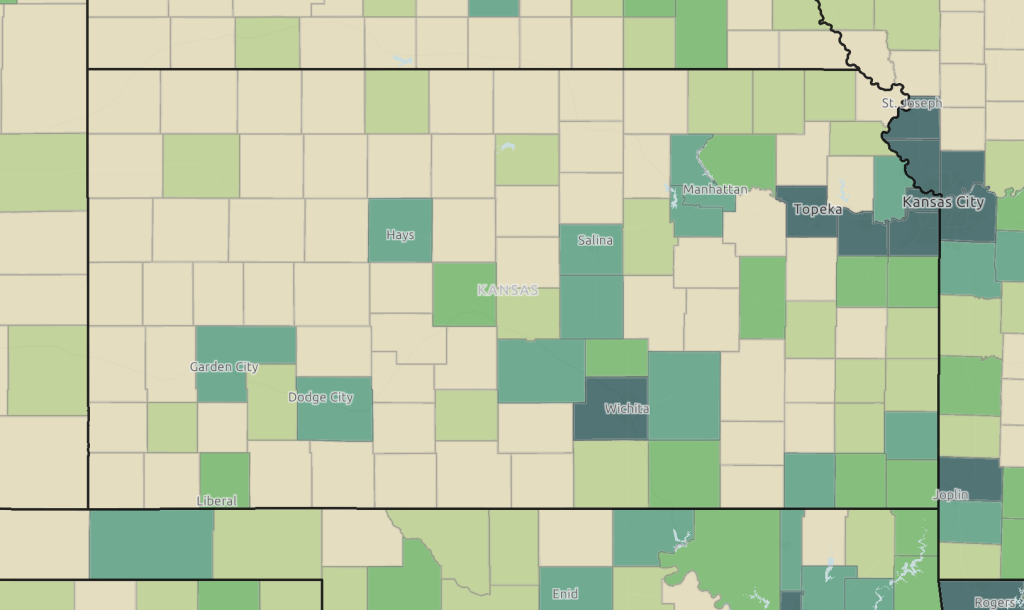
View Gross Domestic Product and use the time period drop down to view previous years.
-
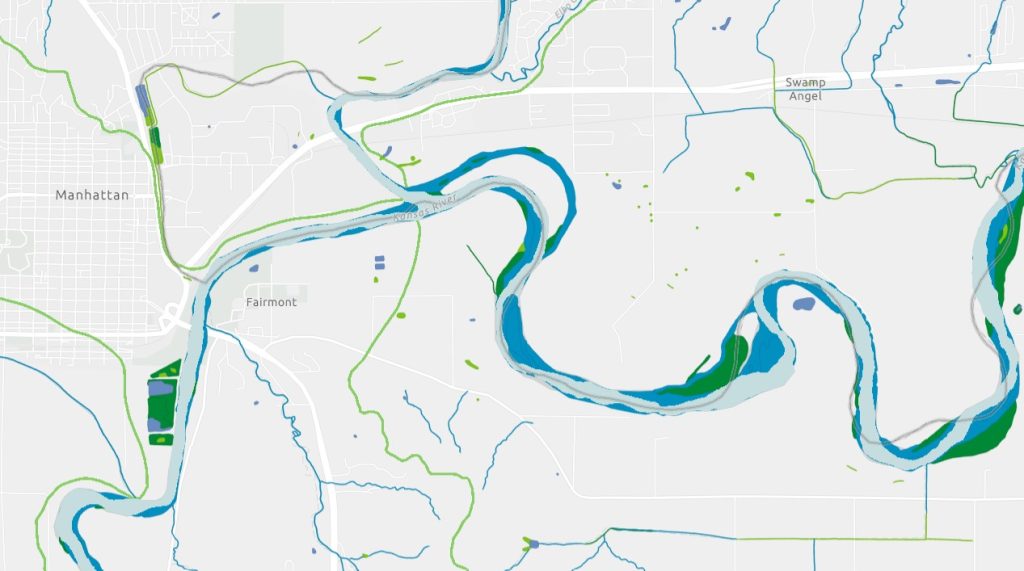
Explore the National Wetlands Inventory across Kansas, as well as watershed boundaries.
-
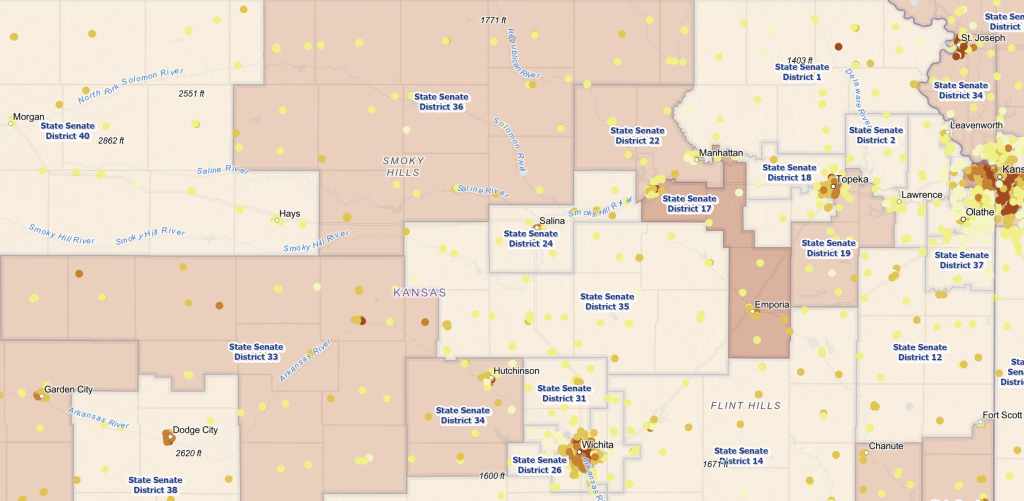
A map of children in poverty (age 0-17) and free and reduced price lunch rates by state Senate district.
-
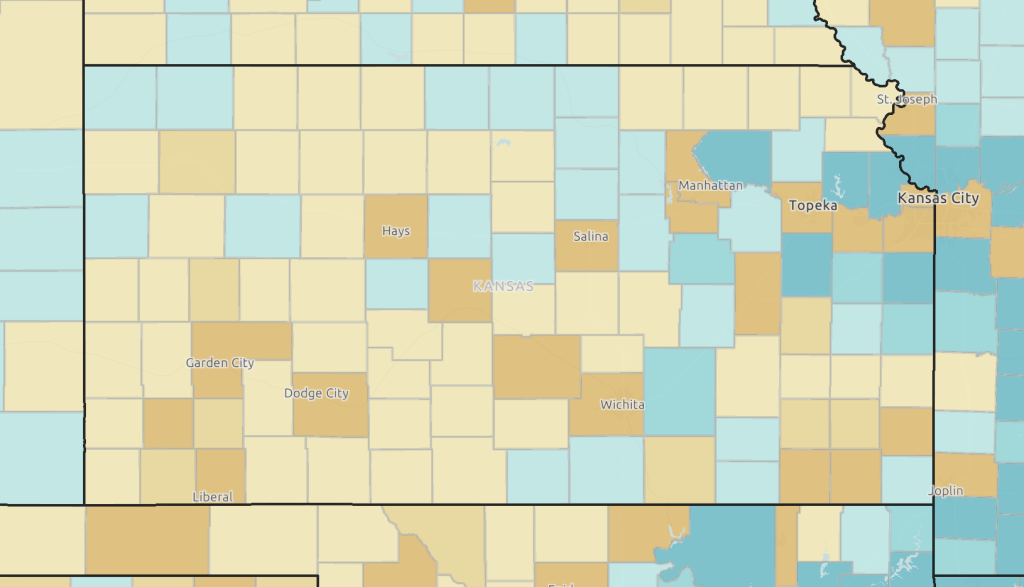
Explore net aggregate income due to migration by county.
-
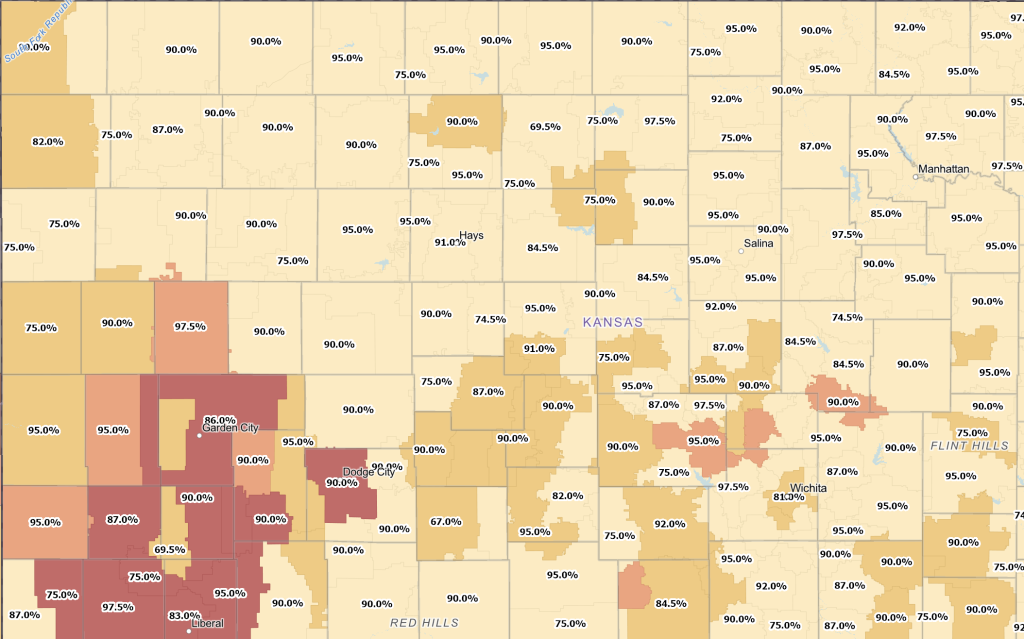
View graduation rates and educational attainment by school district.
-

View corn production by county and the distribution of positive tar spot reports.